
চিত্র:Demographic change in Sweden 1735-2000.png
এর চেয়ে বেশি রেজোলিউশন লভ্য নয়।
Demographic_change_in_Sweden_1735-2000.png (৬৫২ × ৪১৫ পিক্সেল, ফাইলের আকার: ৭ কিলোবাইট, এমআইএমই ধরন: image/png)
| এই ফাইলটি উইকিমিডিয়া কমন্স থেকে নেওয়া। সেখানের বর্ণনা পাতার বিস্তারিত নিম্নে দেখানো হলো। (সম্পাদনা)
|

|
This graph image could be re-created using vector graphics as an SVG file. This has several advantages; see Commons:Media for cleanup for more information. If an SVG form of this image is available, please upload it and afterwards replace this template with
{{vector version available|new image name}}.
It is recommended to name the SVG file “Demographic change in Sweden 1735-2000.svg”—then the template Vector version available (or Vva) does not need the new image name parameter. |
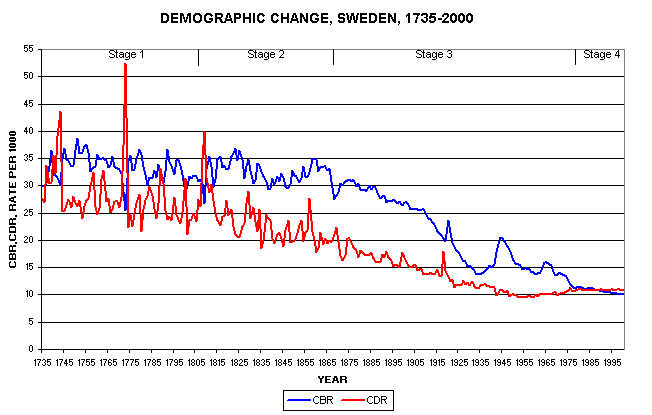
Graph showing demographic change in Sweden over the time period. A good example of a en:Demographic transition.
Taken with permission from [1]
এই ফাইলটি ক্রিয়েটিভ কমন্স অ্যাট্রিবিউশন ২.৫ জেনেরিক লাইসেন্সের আওতায় লাইসেন্সকৃত।
- আপনি স্বাধীনভাবে:
- বণ্টন করতে পারেন – এ কাজটি অনুলিপি, বিতরণ এবং প্রেরণ করতে পারেন
- পুনঃমিশ্রণ করতে পারেন – কাজটি অভিযোজন করতে পারেন
- নিম্নের শর্তাবলীর ভিত্তিতে:
- স্বীকৃতিপ্রদান – আপনাকে অবশ্যই যথাযথ স্বীকৃতি প্রদান করতে হবে, লাইসেন্সের একটি লিঙ্ক সরবরাহ করতে হবে এবং কোনো পরিবর্তন হয়েছে কিনা তা নির্দেশ করতে হবে। আপনি যেকোনো যুক্তিসঙ্গত পদ্ধতিতে এটি করতে পারেন। কিন্তু এমন ভাবে নয়, যাতে প্রকাশ পায় যে লাইসেন্সধারী আপনাকে বা আপনার এই ব্যবহারের জন্য অনুমোদন দিয়েছে।
মূল আপলোড লগ
| তারিখ/সময় | মাত্রা | ব্যবহারকারী | মন্তব্য |
|---|---|---|---|
| ১৪ জুলাই ২০০৫, ০৯:১৩:৩৩ | 652 × 415 (9835 bytes) | Komencanto (আলোচনা · অবদান) | Graph showing demographic change in Sweden over the time period. A good example of a [[en:Demographic transition]]. Taken with permission from [http://www.uwmc.uwc.edu/geography/Demotrans/demtran.htm] {{cc-by-2.5}} |
ফাইলের ইতিহাস
যেকোনো তারিখ/সময়ে ক্লিক করে দেখুন ফাইলটি তখন কী অবস্থায় ছিল।
| তারিখ/সময় | সংক্ষেপচিত্র | মাত্রা | ব্যবহারকারী | মন্তব্য | |
|---|---|---|---|---|---|
| বর্তমান | ১৮:১৪, ১০ ডিসেম্বর ২০১৪ | | ৬৫২ × ৪১৫ (৭ কিলোবাইট) | GifTagger | Bot: Converting file to superior PNG file. (Source: Demographic_change_in_Sweden_1735-2000.gif). This GIF was problematic due to non-greyscale color table. |
সংযোগসমূহ
নিচের পৃষ্ঠা(গুলো) থেকে এই ছবিতে সংযোগ আছে:
ফাইলের বৈশ্বিক ব্যবহার
নিচের অন্যান্য উইকিগুলো এই ফাইলটি ব্যবহার করে:
- bg.wikipedia.org-এ ব্যবহার
- cs.wikipedia.org-এ ব্যবহার
- da.wikipedia.org-এ ব্যবহার
- da.wikibooks.org-এ ব্যবহার
- en.wikipedia.org-এ ব্যবহার
- es.wikipedia.org-এ ব্যবহার
- fi.wikipedia.org-এ ব্যবহার
- fr.wikipedia.org-এ ব্যবহার
- hy.wikipedia.org-এ ব্যবহার
- ja.wikipedia.org-এ ব্যবহার
- ru.wikipedia.org-এ ব্যবহার
- sh.wikipedia.org-এ ব্যবহার
- sr.wikipedia.org-এ ব্যবহার
- sv.wikipedia.org-এ ব্যবহার
- uk.wikipedia.org-এ ব্যবহার