চিত্র:StationaryStatesAnimation.gif

পাতাটির বিষয়বস্তু অন্যান্য ভাষায় নেই।
এই ফাইলটি উইকিমিডিয়া কমন্স থেকে নেওয়া। মূল পাতাটি দেখতে ক্লিক করুন।
উইকিপিডিয়া, মুক্ত বিশ্বকোষ থেকে

StationaryStatesAnimation.gif(৩০০ × ২৮০ পিক্সেল, ফাইলের আকার: ২২৩ কিলোবাইট, এমআইএমই ধরন: image/gif, লুপকৃত, ৪১ ফ্রেম)

এই ফাইলটি উইকিমিডিয়া কমন্স থেকে নেওয়া। সেখানের বর্ণনা পাতার বিস্তারিত নিম্নে দেখানো হলো। (সম্পাদনা)
উইকিমিডিয়া কমন্স, মুক্ত লাইসেন্সযুক্ত মিডিয়ার একটি ভান্ডার। আপনি সাহায্য করতে পারেন

সারাংশ

বিবরণ
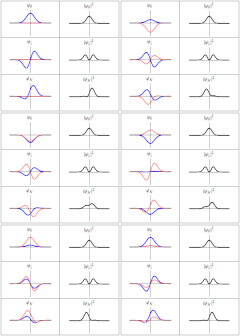
English: Three wavefunction solutions to the Time-Dependent Schrödinger equation for a harmonic oscillator. Left: The real part (blue) and imaginary part (red) of the wavefunction. Right: The probability of finding the particle at a certain position. The top two rows are the lowest two energy eigenstates, and the bottom is the superposition state , which is not an energy eigenstate. The right column illustrates why energy eigenstates are also called "stationary states".
Thus in every quantum stae,there are certain preferred positions of maximum probability
তারিখ
উৎস নিজের কাজ
লেখক Sbyrnes321
(* Source code written in Mathematica 6.0 by Steve Byrnes, Feb. 2011. This source code is public domain. *)
(* Shows classical and quantum trajectory animations for a harmonic potential. Assume m=w=hbar=1. *)
ClearAll["Global`*"]
(*** Wavefunctions of the energy eigenstates ***)
psi[n_, x_] := (2^n*n!)^(-1/2)*Pi^(-1/4)*Exp[-x^2/2]*HermiteH[n, x];
energy[n_] := n + 1/2;
psit[n_, x_, t_] := psi[n, x] Exp[-I*energy[n]*t];
(*** A non-stationary state ***)
SeedRandom[1];
psinonstationary[x_, t_] := (psit[0, x, t]+psit[1, x, t])/Sqrt[2];

(*** Put all the plots together ***)
SetOptions[Plot, {PlotRange -> {-1, 1}, Ticks -> None, PlotStyle -> {Directive[Thick, Blue], Directive[Thick, Pink]}}];
MakeFrame[t_] := GraphicsGrid[
   {{Plot[{Re[psit[0, x, t]], Im[psit[0, x, t]]}, {x, -5, 5}, PlotLabel -> Subscript[\[Psi],0]], 
     Plot[Abs[psit[0, x, t]]^2, {x, -5, 5}, PlotStyle -> Directive[Thick, Black],
		PlotLabel -> TraditionalForm[Abs[Subscript[\[Psi],0]]^2]]},
   {Plot[{Re[psit[1, x, t]], Im[psit[1, x, t]]}, {x, -5, 5}, PlotLabel -> Subscript[\[Psi],1]], 
     Plot[Abs[psit[1, x, t]]^2, {x, -5, 5}, PlotStyle -> Directive[Thick, Black],
		PlotLabel -> TraditionalForm[Abs[Subscript[\[Psi],1]]^2]]},
   {Plot[{Re[psinonstationary[x, t]], Im[psinonstationary[x, t]]}, {x, -5, 5}, PlotLabel -> Subscript[\[Psi],N]], 
     Plot[Abs[psinonstationary[x, t]]^2, {x, -5, 5}, PlotStyle -> Directive[Thick, Black],
		PlotLabel -> TraditionalForm[Abs[Subscript[\[Psi],N]]^2]]}
   }, Frame -> All, ImageSize -> 300];
output = Table[MakeFrame[t], {t, 0, 4 Pi*40/41, 4 Pi/41}];
SetDirectory["C:\\Users\\Steve\\Desktop"]
Export["test.gif", output]

লাইসেন্স প্রদান

আমি, এই কাজের স্বত্বাধিকারী, এতদ্দ্বারা আমি এই কাজকে নিম্ন বর্ণিত লাইসেন্সের আওতায় প্রকাশ করলাম:
Creative Commons CC-Zero এই ফাইলটি ক্রিয়েটিভ কমন্স সিসি০ ১.০ সার্বজনীন পাবলিক ডোমেইন উৎসর্গীকরণের আওতায় রয়েছে।
যেই ব্যক্তিটি এই কাজটির সাথে সংশ্লিষ্ট তিনি এই কাজটি পাবলিক ডোমেইনে মুক্ত করার মাধ্যমে তাঁর সকল স্বত্ত্ব বিশ্বের সকল কপিরাইট আইনের আওতায় ত্যাগ করেছেন। যার মধ্যে নেইবারিং অধিকার, ও আইনের মাধ্যমে এক্সটেন্টও অন্তর্গত। আপনি এই কাজটি কোন অনুমতি চাওয়া ছাড়াই মুক্তভাবে অনুলিপি, পরিবর্তন, বিতরণ করতে পারেন, এবং এমন কি কোনো বাণিজ্যিক কাজেও ব্যবহার করতে পারেন।

ক্যাপশন

এই ফাইল কি প্রতিনিধিত্ব করছে তার এক লাইন ব্যাখ্যা যোগ করুন

এই ফাইলে চিত্রিত আইটেমগুলি

যা চিত্রিত করে

ফাইলের ইতিহাস

যেকোনো তারিখ/সময়ে ক্লিক করে দেখুন ফাইলটি তখন কী অবস্থায় ছিল।

তারিখ/সময়সংক্ষেপচিত্রমাত্রাব্যবহারকারীমন্তব্য
বর্তমান১৮:২১, ২০ মার্চ ২০১১১৮:২১, ২০ মার্চ ২০১১-এর সংস্করণের সংক্ষেপচিত্র৩০০ × ২৮০ (২২৩ কিলোবাইট)Sbyrnes321{{Information |Description ={{en|1=Three wavefunction solutions to the Time-Dependent Schrödinger equation for a harmonic oscillator. Left: The real part (blue) and imaginary part (red) of the wavefunction. Right: The probability of finding the partic

নিচের পৃষ্ঠা(গুলো) থেকে এই ছবিতে সংযোগ আছে:

ফাইলের বৈশ্বিক ব্যবহার

নিচের অন্যান্য উইকিগুলো এই ফাইলটি ব্যবহার করে: