
চিত্র:GISS temperature 2000-09 lrg.png

এই প্রাকদর্শনের আকার: ৮০০ × ৪০০ পিক্সেল। অন্যান্য আকারসমূহ: ৩২০ × ১৬০ পিক্সেল | ৬৪০ × ৩২০ পিক্সেল | ১,০২৪ × ৫১২ পিক্সেল | ১,২৮০ × ৬৪০ পিক্সেল | ২,৮৮০ × ১,৪৪০ পিক্সেল।
পূর্ণ রেজোলিউশন (২,৮৮০ × ১,৪৪০ পিক্সেল, ফাইলের আকার: ৫৪৫ কিলোবাইট, এমআইএমই ধরন: image/png)
| এই ফাইলটি উইকিমিডিয়া কমন্স থেকে নেওয়া। সেখানের বর্ণনা পাতার বিস্তারিত নিম্নে দেখানো হলো। (সম্পাদনা)
|
সারাংশ
| বিবরণ |
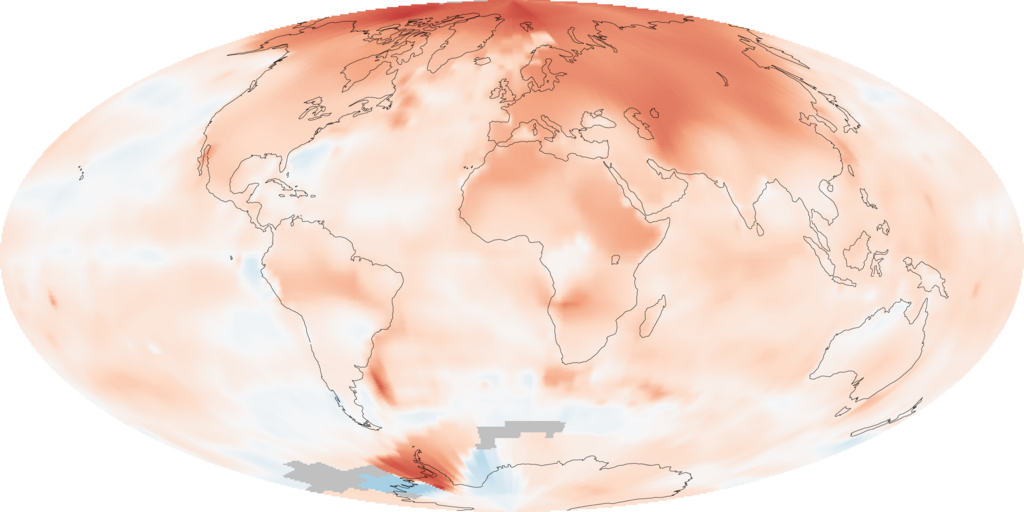
English: The map illustrates just how much warmer temperatures were in the decade (2000-2009) compared to average temperatures recorded between 1951 and 1980 (a common reference period for climate studies). The most extreme warming, shown in red, was in the Arctic. Very few areas saw cooler than average temperatures, shown in blue. Gray areas over parts of the Southern Ocean are places where temperatures were not recorded. The analysis, conducted by the Goddard Institute for Space Studies (GISS) in New York City, is based on temperatures recorded at meteorological (weather) stations around the world and satellite data over the oceans.
|
| তারিখ | |
| উৎস | NASA Earth Observatory Image of the Day: 2009 Ends Warmest Decade on Record http://earthobservatory.nasa.gov/IOTD/view.php?id=42392 |
| লেখক | NASA images by Robert Simmon, based on data from the Goddard Institute for Space Studies. |
লাইসেন্স প্রদান
| এই ফাইলটি পাবলিক ডোমেইনে আছে কারণ এটি শুধুমাত্র নাসা কর্তৃক নির্মিত হয়েছিল। নাসার কপিরাইট নীতি হচ্ছে যে "নাসা কর্তৃক উল্লেখ না থাকলে নাসার উপাদান কপিরাইট দ্বারা সুরক্ষিত নয়"। (Template:PD-USGov, নাসার কপিরাইট নীতির পাতা অথবা জেপিএল চিত্র ব্যবহারের নীতি দেখুন।) | ||
 |
সতর্কবার্তা:
|
ফাইলের ইতিহাস
যেকোনো তারিখ/সময়ে ক্লিক করে দেখুন ফাইলটি তখন কী অবস্থায় ছিল।
| তারিখ/সময় | সংক্ষেপচিত্র | মাত্রা | ব্যবহারকারী | মন্তব্য | |
|---|---|---|---|---|---|
| বর্তমান | ০৩:০৯, ২৩ জানুয়ারি ২০১০ | | ২,৮৮০ × ১,৪৪০ (৫৪৫ কিলোবাইট) | Petersam | {{Information |Description={{en|1=The map illustrate just how much warmer temperatures were in the decade (2000-2009) compared to average temperatures recorded between 1951 and 1980 (a common reference period for climate studies). The most extreme warming |
সংযোগসমূহ
নিচের পৃষ্ঠা(গুলো) থেকে এই ছবিতে সংযোগ আছে:
ফাইলের বৈশ্বিক ব্যবহার
নিচের অন্যান্য উইকিগুলো এই ফাইলটি ব্যবহার করে:
- ar.wikipedia.org-এ ব্যবহার
- as.wikipedia.org-এ ব্যবহার
- bxr.wikipedia.org-এ ব্যবহার
- cs.wikipedia.org-এ ব্যবহার
- en.wikipedia.org-এ ব্যবহার
- en.wikiversity.org-এ ব্যবহার
- es.wikipedia.org-এ ব্যবহার
- fa.wikipedia.org-এ ব্যবহার
- fr.wikipedia.org-এ ব্যবহার
- id.wikipedia.org-এ ব্যবহার
- ilo.wikipedia.org-এ ব্যবহার
- it.wikipedia.org-এ ব্যবহার
- ko.wikipedia.org-এ ব্যবহার
- or.wikipedia.org-এ ব্যবহার
- pnb.wikipedia.org-এ ব্যবহার
- pt.wikipedia.org-এ ব্যবহার
- pt.wikinews.org-এ ব্যবহার
- si.wikipedia.org-এ ব্যবহার
- sv.wikipedia.org-এ ব্যবহার
- uk.wikipedia.org-এ ব্যবহার
- vi.wikipedia.org-এ ব্যবহার
- www.wikidata.org-এ ব্যবহার
- zh.wikipedia.org-এ ব্যবহার