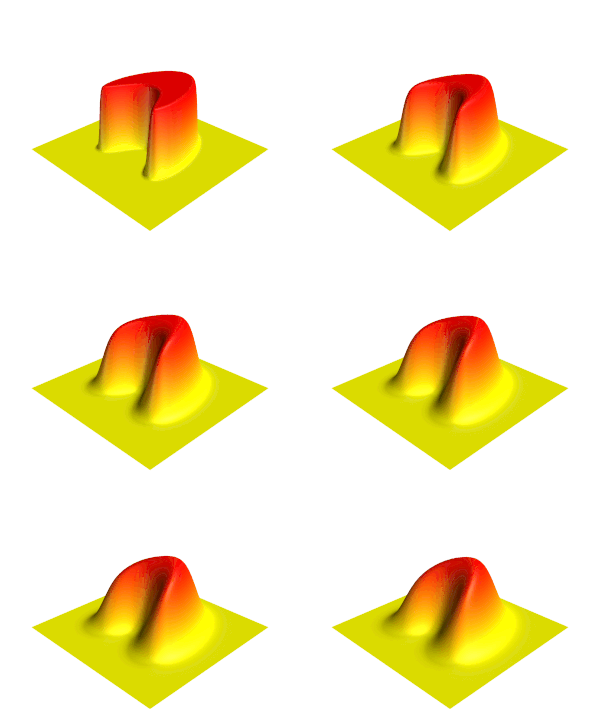
চিত্র:Heat eqn.gif

পাতাটির বিষয়বস্তু অন্যান্য ভাষায় নেই।
এই ফাইলটি উইকিমিডিয়া কমন্স থেকে নেওয়া। মূল পাতাটি দেখতে ক্লিক করুন।
উইকিপিডিয়া, মুক্ত বিশ্বকোষ থেকে

Heat_eqn.gif(২০০ × ১৩৬ পিক্সেল, ফাইলের আকার: ৫০০ কিলোবাইট, এমআইএমই ধরন: image/gif, লুপকৃত, ১৮১ ফ্রেম, ৬.০ সে)

এই ফাইলটি উইকিমিডিয়া কমন্স থেকে নেওয়া। সেখানের বর্ণনা পাতার বিস্তারিত নিম্নে দেখানো হলো। (সম্পাদনা)
উইকিমিডিয়া কমন্স, মুক্ত লাইসেন্সযুক্ত মিডিয়ার একটি ভান্ডার। আপনি সাহায্য করতে পারেন

সারাংশ

বিবরণ
English: Illustration of the Heat equation.
তারিখ (UTC)
উৎস নিজের কাজ
 
এই ডায়াগ্রামটি MATLAB দিয়ে তৈরি করা হয়েছে।
লেখক Oleg Alexandrov
অন্যান্য সংস্করণ

লাইসেন্স প্রদান

Public domain আমি, এই কাজের স্বত্বাধিকারী, এতদ্দ্বারা আমি এই কাজকে পাবলিক ডোমেইন লাইসেন্সের আওতায় প্রকাশ করলাম। এটি বিশ্বব্যাপী প্রযোজ্য হবে।
কিছু দেশে এটি আইনত সিদ্ধ নাও হতে পারে, যদি তাই হয়:
আমি যে-কাউকে এই কাজটি যেকোনো উদ্দেশ্যে, বিনাশর্তে ব্যবহারের অনুমতি প্রদান করছি, যদি না সেই শর্তগুলো আইনত প্রয়োজনীয় হয়।

MATLAB source code

% illustration of the heat equation
% Solve the heat equation using finite differences and Forward Euler
function main()
 
   % the number of data points. More points means prettier picture.
   N = 400;
 
   L = 2.5; % the box size is [-L, L] x [-L, L]
 
   XX = linspace(-L, L, N);
   YY = linspace(-L, L, N);
   [X, Y] = meshgrid(XX, YY);
 
   scale = 2;
   Z = get_step_function (N, scale, X, Y);
 
   CFL = 0.125; % CourantFriedrichsLewy
   dx = XX(2)-XX(1);  dy = dx; % space grid
   dt = CFL*dx^2;
 
   plot_dt = 0.004; % plot every plot_dt iterations

   cmap = rv_matrix_rows(autumn); % colormap
   
   % Solve the heat equation with zero boundary conditions
   T = 0:dt:1;
   iter = 0;
   frame_no = 0;
   for t=T
 
      % plot the current temperature distribution
      if floor(t/plot_dt) + 1 > frame_no
 
         frame_no = frame_no + 1
 
        % plot the surface
         figure(2); clf; 
         surf(X, Y, Z);
 
         %  make the surface beautiful
         shading interp; colormap(cmap); 
 
         % add in a source of light
         camlight (-50, 54);
         lighting phong;
 
         % viewing angle
         view(-40, 38);
 
         axis equal; axis off;
         axis([-L, L, -L, L, 0, scale])
 
         hold on; plot3(0, 0, 3.4, 'g*'); % a marker to help with cropping
 
         pause(0.1);
         %return
 
         file = sprintf('Movie_frame%d.png', 1000+frame_no);
         %saveas(gcf, file) %save the current frame
         print(gcf, '-dpng', '-r400', file) %save the current frame
 
         disp(file); %show the frame number we are at
 
         % cut at max_fr_no frames
         max_fr_no = 15; 
         if frame_no >= max_fr_no
            break
         end
 
      end
 
      % advance in time
      W = 0*Z;
      for i=2:(N-1)
         for j=2:(N-1)
 
            W(i, j) = Z(i, j) + dt * ( Z(i+1, j) + Z(i-1, j) + Z(i, j-1) + Z(i, j+1) - 4*Z(i, j))/dx^2;
 
         end
      end
      Z = W;
 
   end
 
 
% The gif image was creating with the command 
% convert -antialias -loop 10000  -delay 20 -compress LZW Movie_frame10* Heat_eqn.gif 
 
% get a function which is 1 on a set, and 0 outside of it
function Z = get_step_function(N, scale, X, Y)
 
   c = 2;
   d=-1;
   e=1;
   f=0.5;
   k=1.2;
   shift=10;
 
   Z = (c^2-(X/e-d).^2-(Y/f).^2).^2 + k*(c+d-X/e).^3-shift;
 
   Z = 1-max(sign(Z), 0);
   Z = scale*Z;

function X = rv_matrix_rows(X)

   [m, n] = size(XL);

   for i = 1:m
      j = m + 1 - i;
      if i < j
         tmp = X(i, :); X(i, :) = X(j, :); X(j, :) = tmp;
      end
   end

ক্যাপশন

এই ফাইল কি প্রতিনিধিত্ব করছে তার এক লাইন ব্যাখ্যা যোগ করুন

এই ফাইলে চিত্রিত আইটেমগুলি

যা চিত্রিত করে

ফাইলের ইতিহাস

যেকোনো তারিখ/সময়ে ক্লিক করে দেখুন ফাইলটি তখন কী অবস্থায় ছিল।

তারিখ/সময়সংক্ষেপচিত্রমাত্রাব্যবহারকারীমন্তব্য
বর্তমান১৮:০১, ২ ফেব্রুয়ারি ২০২৪১৮:০১, ২ ফেব্রুয়ারি ২০২৪-এর সংস্করণের সংক্ষেপচিত্র২০০ × ১৩৬ (৫০০ কিলোবাইট)Jahobrmore frames (by user Emil Dalalyan)
০১:২৫, ১২ এপ্রিল ২০১৯০১:২৫, ১২ এপ্রিল ২০১৯-এর সংস্করণের সংক্ষেপচিত্র২০০ × ১৩৬ (১৭২ কিলোবাইট)Jorge StolfiDuplicated some framed at beginning so that readers can see the initial state. Added a couple blank frames at end to make it clear that the simulation ended. Slowed down the movie a bit.
১৯:৫৮, ২৪ এপ্রিল ২০১১১৯:৫৮, ২৪ এপ্রিল ২০১১-এর সংস্করণের সংক্ষেপচিত্র২০০ × ১৩৬ (১১৬ কিলোবাইট)Oleg AlexandrovReverse the colormap (red is high).
০৬:১১, ২৩ নভেম্বর ২০০৭০৬:১১, ২৩ নভেম্বর ২০০৭-এর সংস্করণের সংক্ষেপচিত্র১৯৯ × ১৪০ (১২৬ কিলোবাইট)Oleg AlexandrovTweak, same license
০৫:৫১, ২৩ নভেম্বর ২০০৭০৫:৫১, ২৩ নভেম্বর ২০০৭-এর সংস্করণের সংক্ষেপচিত্র২০০ × ১২৯ (১১২ কিলোবাইট)Oleg Alexandrov{{Information |Description=Illustration of the en:Heat equation |Source=self-made with Matlab |Date=~~~~~ |Author= Oleg Alexandrov |Permission=PD-self, see below |other_versions= }} {{PD-self}} ==MATLAB source code== <pre>

নিচের পৃষ্ঠা(গুলো) থেকে এই ছবিতে সংযোগ আছে:

ফাইলের বৈশ্বিক ব্যবহার

নিচের অন্যান্য উইকিগুলো এই ফাইলটি ব্যবহার করে: