চিত্র:Halflife-sim.gif

পাতাটির বিষয়বস্তু অন্যান্য ভাষায় নেই।
এই ফাইলটি উইকিমিডিয়া কমন্স থেকে নেওয়া। মূল পাতাটি দেখতে ক্লিক করুন।
উইকিপিডিয়া, মুক্ত বিশ্বকোষ থেকে

Halflife-sim.gif(১০০ × ১৮৮ পিক্সেল, ফাইলের আকার: ১৭ কিলোবাইট, এমআইএমই ধরন: image/gif, লুপকৃত, ৮০ ফ্রেম, ৮.৫ সে)

এই ফাইলটি উইকিমিডিয়া কমন্স থেকে নেওয়া। সেখানের বর্ণনা পাতার বিস্তারিত নিম্নে দেখানো হলো। (সম্পাদনা)
উইকিমিডিয়া কমন্স, মুক্ত লাইসেন্সযুক্ত মিডিয়ার একটি ভান্ডার। আপনি সাহায্য করতে পারেন

সারাংশ

বিবরণ
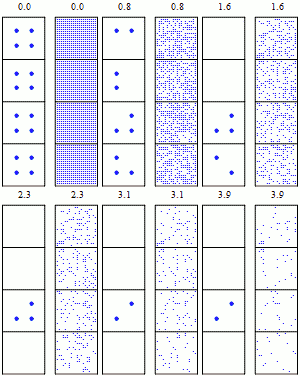
English: Simulation of many identical atoms undergoing radioactive decay, starting with either four atoms (left) or 400 atoms (right). The number at the top indicates how many half-lives have elapsed. Note the law of large numbers: With more atoms, the overall decay is less random. Image made with Mathematica, I am happy to send the source code if you would like to make this image more beautiful, or for any other reason.
তারিখ
উৎস নিজের কাজ
লেখক Sbyrnes321

লাইসেন্স প্রদান

Public domain আমি, এই কাজের স্বত্বাধিকারী, এতদ্দ্বারা আমি এই কাজকে পাবলিক ডোমেইন লাইসেন্সের আওতায় প্রকাশ করলাম। এটি বিশ্বব্যাপী প্রযোজ্য হবে।
কিছু দেশে এটি আইনত সিদ্ধ নাও হতে পারে, যদি তাই হয়:
আমি যে-কাউকে এই কাজটি যেকোনো উদ্দেশ্যে, বিনাশর্তে ব্যবহারের অনুমতি প্রদান করছি, যদি না সেই শর্তগুলো আইনত প্রয়োজনীয় হয়।
(* Source code written in Mathematica 6.0, by Steve Byrnes, 2010. I release this code into the public domain. *)

SeedRandom[2]

(*Build list of point coordinates and radii*)

BuildCoordList[SqCenterX_, SqCenterY_, SqSide_, PtsPerRow_] := 
  Flatten[Table[{i, j}, {i, SqCenterX - SqSide/2, SqCenterX + SqSide/2, SqSide/(PtsPerRow - 1)},
     {j, SqCenterY - SqSide/2, SqCenterY + SqSide/2, SqSide/(PtsPerRow - 1)}], 1];

coordslist = Join[
   BuildCoordList[3.5, 1, 1.8, 20],
   BuildCoordList[3.5, 3, 1.8, 20],
   BuildCoordList[3.5, 5, 1.8, 20],
   BuildCoordList[3.5, 7, 1.8, 20],
   BuildCoordList[1, 1, .7, 2],
   BuildCoordList[1, 3, .7, 2],
   BuildCoordList[1, 5, .7, 2],
   BuildCoordList[1, 7, .7, 2]];
NumPts = Length[coordslist];
radiuslist = Join[Table[.03, {i, 1, 4*400}], Table[.1, {i, 1, 4*4}]];

(*Draw borders*)

xlist = {0, 2};
leftx = 0;
rightx = 2;
numx = Length[xlist];
ylist = {0, 2, 4, 6, 8};
topy = 0;
boty = 8;
numy = Length[ylist];
lines = {};
For[i = 1, i <= numy, i++, 
  lines = Append[lines, Line[{{leftx, ylist[[i]]}, {rightx, ylist[[i]]}}]]];
For[i = 1, i <= numx, i++, 
  lines = Append[lines, Line[{{xlist[[i]], topy}, {xlist[[i]], boty}}]]];

xlist = {2.5, 4.5};
leftx = 2.5;
rightx = 4.5;
numx = Length[xlist];
ylist = {0, 2, 4, 6, 8};
topy = 0;
boty = 8;
numy = Length[ylist];
For[i = 1, i <= numy, i++, 
  lines = Append[lines, Line[{{leftx, ylist[[i]]}, {rightx, ylist[[i]]}}]]];
For[i = 1, i <= numx, i++, 
  lines = Append[lines, Line[{{xlist[[i]], topy}, {xlist[[i]], boty}}]]];

(*Write numbers:
I want to be able to write a number with one decimal place,
including padding with ".0" when it's an integer.*)

WriteNum[num_] := Block[{rounded}, rounded = N[Floor[num, 0.1]];
    If[FractionalPart[rounded] == 0, ToString[rounded] <> "0", ToString[rounded]]];

(*Randomly choose decay times:
To get an expontial-decay-distributed random number, we pick a number uniformly between 0 and 1.
Take its negative log to get the time that it blows up, which is between 0 and infinity.
But divide by log 2 so that when the time = 1, there's 50% chance of decaying. *)

BlowTime = Table[-Log[RandomReal[]]/Log[2], {i, 1, NumPts}];

(*Draw graphics*)

GraphicsList = {};
NumFrames = 80;
TimePerFrame = .05;

Video = {};
For[frame = 1, frame <= NumFrames, frame++,
  CurrentTime = (frame - 1)*TimePerFrame;
  ImageGraphicsList = lines;
  ImageGraphicsList = 
   Append[ImageGraphicsList, Text[WriteNum[CurrentTime], {.8, 8.5}, {-1, 0}]];
  ImageGraphicsList = 
   Append[ImageGraphicsList, Text[WriteNum[CurrentTime], {3.3, 8.5}, {-1, 0}]];
  For[pt = 1, pt <= NumPts, pt++,
   If[CurrentTime < BlowTime[[pt]], 
    ImageGraphicsList =   Append[ImageGraphicsList, {Blue, Disk[coordslist[[pt]], radiuslist[[pt]]]}]]];
  Video = Append[Video, Graphics[ImageGraphicsList, ImageSize -> 100]];];

(*Pause at start*)
Video = Join[Table[Video[[1]], {i, 1, 5}], Video];

(*Export*)
Export["test.gif", Video, "DisplayDurations" -> {10}, "AnimationRepititions" -> Infinity ]

ক্যাপশন

এই ফাইল কি প্রতিনিধিত্ব করছে তার এক লাইন ব্যাখ্যা যোগ করুন

এই ফাইলে চিত্রিত আইটেমগুলি

যা চিত্রিত করে

ফাইলের ইতিহাস

যেকোনো তারিখ/সময়ে ক্লিক করে দেখুন ফাইলটি তখন কী অবস্থায় ছিল।

তারিখ/সময়সংক্ষেপচিত্রমাত্রাব্যবহারকারীমন্তব্য
বর্তমান১৯:৪১, ২৫ মার্চ ২০১০১৯:৪১, ২৫ মার্চ ২০১০-এর সংস্করণের সংক্ষেপচিত্র১০০ × ১৮৮ (১৭ কিলোবাইট)AiyizoOptimized animation, converted to 16 color mode
০৬:৩৫, ৫ ফেব্রুয়ারি ২০১০০৬:৩৫, ৫ ফেব্রুয়ারি ২০১০-এর সংস্করণের সংক্ষেপচিত্র১০০ × ১৮৮ (১৫৬ কিলোবাইট)Sbyrnes321Changed top-bottom split to left-right split, with space between; pause at start; 400 atoms in each crowded box instead of 296. (Thanks to Bdb484 for suggestions.)
০০:২৬, ২৯ জানুয়ারি ২০১০০০:২৬, ২৯ জানুয়ারি ২০১০-এর সংস্করণের সংক্ষেপচিত্র৬১ × ১৩১ (৭৫ কিলোবাইট)Sbyrnes321{{Information |Description={{en|1=Simulation of many identical atoms undergoing radioactive decay. The number at the top indicates how many half-lives have elapsed. Note that after one half-life there are not ''exactly'' one-half of the atoms remaining, o

নিচের পৃষ্ঠা(গুলো) থেকে এই ছবিতে সংযোগ আছে:

ফাইলের বৈশ্বিক ব্যবহার

নিচের অন্যান্য উইকিগুলো এই ফাইলটি ব্যবহার করে: