
চিত্র:Atmospheric Pressure vs. Altitude.png
এর চেয়ে বেশি রেজোলিউশন লভ্য নয়।
Atmospheric_Pressure_vs._Altitude.png (৮০০ × ৬০০ পিক্সেল, ফাইলের আকার: ১৫ কিলোবাইট, এমআইএমই ধরন: image/png)
| এই ফাইলটি উইকিমিডিয়া কমন্স থেকে নেওয়া। সেখানের বর্ণনা পাতার বিস্তারিত নিম্নে দেখানো হলো। (সম্পাদনা)
|

|
This graph image could be re-created using vector graphics as an SVG file. This has several advantages; see Commons:Media for cleanup for more information. If an SVG form of this image is available, please upload it and afterwards replace this template with
{{vector version available|new image name}}.
It is recommended to name the SVG file “Atmospheric Pressure vs. Altitude.svg”—then the template Vector version available (or Vva) does not need the new image name parameter. |
সারাংশ
| বিবরণ |
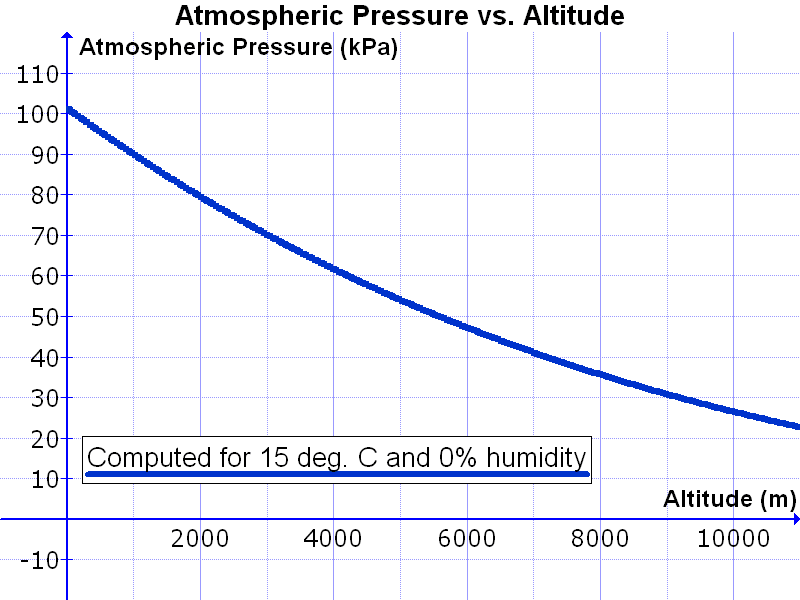
English: Graph of atmospheric pressure (in kPa) vs. altitude above sea level (in meters). Based on an equation from the CRC manual, a temperature of 15 deg. C and a relative humidity of 0%. |
| তারিখ | |
| উৎস | নিজের কাজ |
| লেখক | Geek.not.nerd |
লাইসেন্স প্রদান
আমি, এই কাজের স্বত্বাধিকারী, এতদ্দ্বারা আমি এই কাজকে নিম্ন বর্ণিত লাইসেন্সের আওতায় প্রকাশ করলাম:
| এই ফাইলটি ক্রিয়েটিভ কমন্স সিসি০ ১.০ সার্বজনীন পাবলিক ডোমেইন উৎসর্গীকরণের আওতায় রয়েছে। | |
| যেই ব্যক্তিটি এই কাজটির সাথে সংশ্লিষ্ট তিনি এই কাজটি পাবলিক ডোমেইনে মুক্ত করার মাধ্যমে তাঁর সকল স্বত্ত্ব বিশ্বের সকল কপিরাইট আইনের আওতায় ত্যাগ করেছেন। যার মধ্যে নেইবারিং অধিকার, ও আইনের মাধ্যমে এক্সটেন্টও অন্তর্গত। আপনি এই কাজটি কোন অনুমতি চাওয়া ছাড়াই মুক্তভাবে অনুলিপি, পরিবর্তন, বিতরণ করতে পারেন, এবং এমন কি কোনো বাণিজ্যিক কাজেও ব্যবহার করতে পারেন।
|
ফাইলের ইতিহাস
যেকোনো তারিখ/সময়ে ক্লিক করে দেখুন ফাইলটি তখন কী অবস্থায় ছিল।
| তারিখ/সময় | সংক্ষেপচিত্র | মাত্রা | ব্যবহারকারী | মন্তব্য | |
|---|---|---|---|---|---|
| বর্তমান | ২১:১৪, ৪ মে ২০১১ | | ৮০০ × ৬০০ (১৫ কিলোবাইট) | Geek.not.nerd | {{Information |Description ={{en|1=Graph of atmospheric pressure (in kPa) vs. altitude above sea level (in meters). Based on an equation from the CRC manual, a temperature of 15 deg. C and a relative humidity of 0%.}} |Source ={{own}} |Author |
সংযোগসমূহ
নিচের পৃষ্ঠা(গুলো) থেকে এই ছবিতে সংযোগ আছে:
ফাইলের বৈশ্বিক ব্যবহার
নিচের অন্যান্য উইকিগুলো এই ফাইলটি ব্যবহার করে:
- en.wikipedia.org-এ ব্যবহার
- fa.wikipedia.org-এ ব্যবহার
- fi.wikipedia.org-এ ব্যবহার
- hi.wikipedia.org-এ ব্যবহার
- hr.wikipedia.org-এ ব্যবহার
- nl.wikipedia.org-এ ব্যবহার
- pl.wikipedia.org-এ ব্যবহার
- ro.wikipedia.org-এ ব্যবহার
- ru.wikipedia.org-এ ব্যবহার
- sr.wikipedia.org-এ ব্যবহার